Context
Hong Kong is a special administrative region of China. They work under a two-law regime.
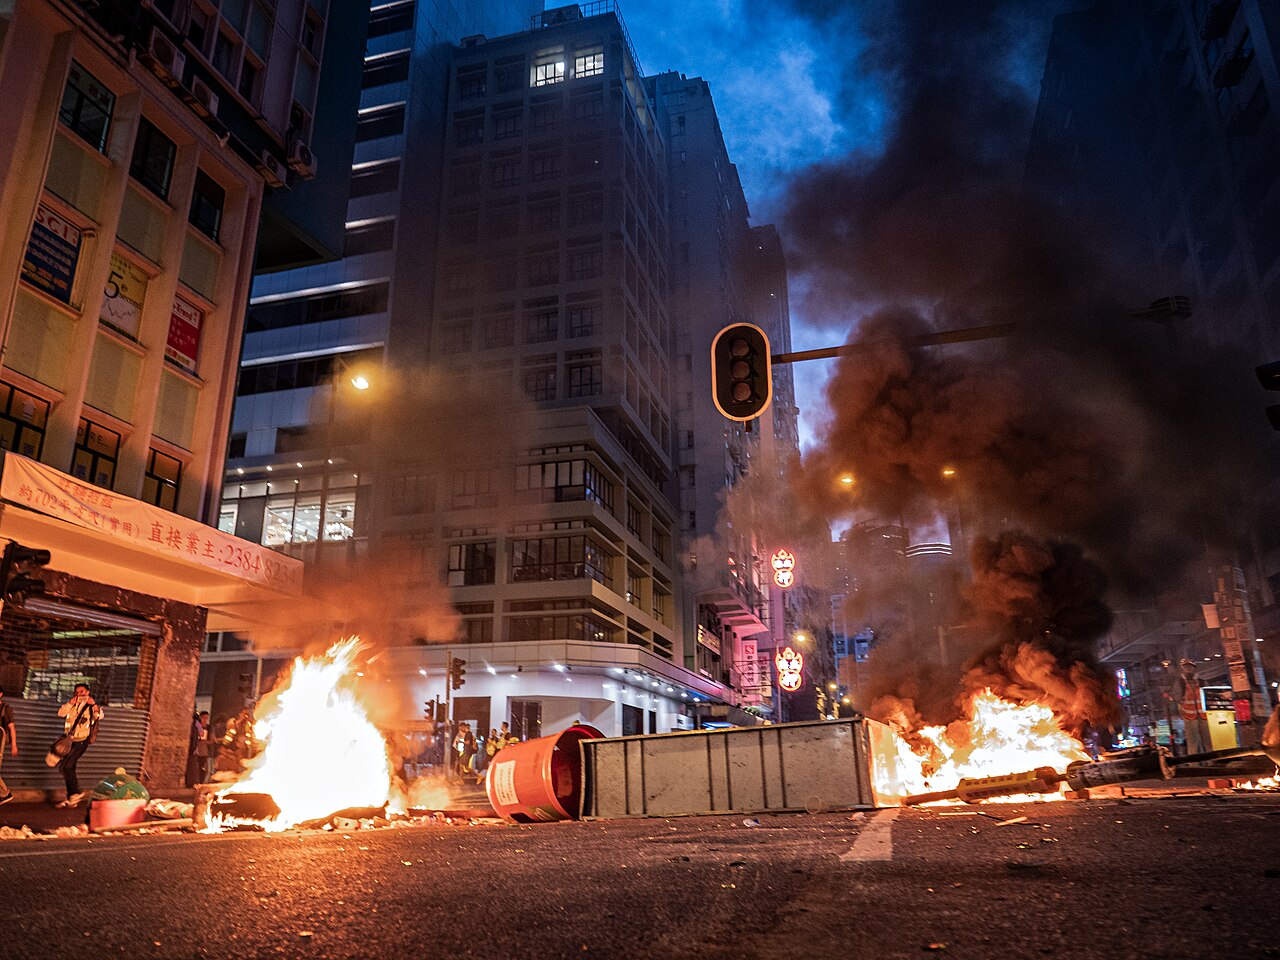
The 2014, protests began after the Standing Committee of the National People’s Congress (NPCSC) issued a decision regarding proposed reforms to the Hong Kong electoral system. The decision was widely seen to be highly restrictive, and tantamount to the Chinese Communist Party (CCP)‘s. 1 This protests lasted aroung 80 days, and the term ’Umbrella Movement’ was coined (as they used umbrellas to protect themselves against police pepper spray, and others). Later on in 2019, the largest series of demonstrations in the history of Hong Kong ocurred, motivated by another bill, this one would allow criminal suspects to be extradited on a case-by-case basis to any jurisdiction without pre-existing extradition treaties with Hong Kong, including mainland China. It was feared that this bill would erode Hong Kong’s autonomy, raising concerns due to China’s history of political repression. 2
Aditionally, the 1967 riots, the ones for which we have the list of victims, were large-scale anti-government riots that occurred in Hong Kong during British colonial rule. 3
Throughout the last two peirods (2014 and 2019), Chinese and Hong Kongnese citizens have struggled under severe scrutiny due to lack of privacy, corruption, isolation, and an overall controlling and all-powerful Government who holds all the cards (institutions), and has no regard (for the people). China has a long history of inequality that is only getting worse as more and more rights are denied.
This dataframe is, again, from ACLED but it has more information (like event type and subtype), so it will allows us to make a more detailed overview of China’s situation. It does not distinguish China from Hong Kong. 4
那些被討厭的人 (Those who are hated) 5
These are the registered victims of the Chinese riot of 1967.6
For more information, and data analysis of the type of consequences (besides death) faced by Hong Kongnese rioters in the 2019 Umbrella Movement, check out this website: https://hongkongfp.com/2022/07/16/explained-in-data-what-happened-to-hong-kongs-protesters/
Código
library(rvest)
library(dplyr)
library(janitor)
library(stringr)
library(htmltools)

scrape_hk1967 <- function(url) {
  # Load the page
  page <- read_html(url)

  # Extract all tables and clean their names
  tables <- page %>%
    html_nodes("table") %>%
    html_table(fill = TRUE) %>%
    lapply(clean_names)

  # Find the table that has both name and age like columns
  victims_tbl <- NULL
  for (tbl in tables) {
    cn <- names(tbl)
    if (any(grepl("name", cn)) && any(grepl("age", cn))) {
      victims_tbl <- tbl
      break
    }
  }

  if (is.null(victims_tbl)) {
    stop("Could not find a casualties table with Name and Age columns.")
  }

  # Standardize column names
  colnames(victims_tbl) <- tolower(colnames(victims_tbl))

  # Detect matching columns
  name_col <- grep("name", colnames(victims_tbl), value = TRUE)[1]
  age_col  <- grep("age", colnames(victims_tbl), value = TRUE)[1]

  # Select and clean
  victims_clean <- victims_tbl %>%
    select(
      Name = all_of(name_col),
      Age  = all_of(age_col)
    ) %>%
    mutate(
      Age = as.numeric(Age),
      Name = str_remove_all(Name, "\\[.*?\\]|\\(.*?\\)")
    )

  return(victims_clean)
}

url_hk1967 <- "https://en.wikipedia.org/wiki/1967_Hong_Kong_riots#Casualties"
victims_all2 <- scrape_hk1967(url_hk1967)

# Create horizontal scroll cards with black-and-white theme
cards <- lapply(1:nrow(victims_all2), function(i) {
  htmltools::tags$div(
    style = paste(
      "flex: 0 0 200px;",
      "border:1px solid #000;",        # black
      "border-radius:10px;",
      "padding:20px;",
      "margin:5px;",
      "height:100px;",
      "text-align:center;",
      "background-color:#fff;",        # white
      "color:#000;",                   # black
      "box-shadow: 2px 2px 5px rgba(0,0,0,0.2);"  # shadow
    ),
    htmltools::tags$strong(victims_all2$Name[i]),
    htmltools::tags$br(),
    paste("Age:", victims_all2$Age[i])
  )
})

# Carousel container with horizontal scroll
carousel <- htmltools::tags$div(
  style = paste(
    "display: flex;",
    "overflow-x: auto;",
    "scroll-snap-type: x mandatory;",
    "padding: 10px;",
    "background-color:#000;"  # black background
  ),
  cards
)

htmltools::browsable(carousel)Age: 14
Age: 42
Age: 52
Age: 29
Age: 30
Age: 34
Age: 30
Age: 45
Age: 40
Age: 19
Age: 28
Age: 27
Age: 27
Age: 41
Age: 32
Age: 43
Age: 21
Age: 27
Age: 35
Age: 48
Age: NA
Age: NA
Age: 34
Age: NA
Age: NA
Age: 28
Age: NA
Age: 8
Age: 2
Age: 37
Age: 26
Age: 21
Age: NA
Age: 22
Age: 38
Age: NA
Age: NA
Age: 19
Age: 18
Age: 37
Age: NA
Age: NA
Trends & Look Up
Similarly to the global case, we will see an evolution of China protests’, but by event type:
Código
p.china <- df_china |>
  ggplot(aes(
    x = WEEK,
    y = FATALITIES,
    group = EVENT_TYPE,
    data_id = EVENT_TYPE,
    color = EVENT_TYPE
  )) +
  geom_line_interactive(
    linewidth = 0.5,
    hover_nearest = TRUE,
    aes(tooltip = EVENT_TYPE)
  ) +
  scale_color_brewer() +
  labs(
    x = "Weeks",
    y = "Number of fatalities",
    title = "Fatal Trends",
    subtitle = "by event type"
  )

p.china <- girafe(ggobj = p.china)
p.china
Given that the frequency is by weeks, the evolution doesn’t tell much information. Therefore I provide the same look-up table as for the global case:
Código
Most Fatal Events
Coming from the previous graphs and table, I became interested in which type of event causes the most fatalities throughout our time period. We calculate and showcase as follows:
Código
bar.china <- df_china |>
  group_by(SUB_EVENT_TYPE) |>
  summarise(
    total_fatal = sum(FATALITIES, na.rm = TRUE)
  ) |>
  arrange(desc(total_fatal)) |>
  slice_head(n = 10) |>
  ggplot( aes(
    x = reorder(SUB_EVENT_TYPE, total_fatal),
    y = total_fatal,
    tooltip = paste(
      "Sub-event type:", SUB_EVENT_TYPE,
      "<br>Total fatalities:", total_fatal
    ),
    data_id = SUB_EVENT_TYPE
  )
) +
  geom_bar_interactive(
    stat = "identity",
    fill = "#003B5D",
    width = 0.7
  ) +
  coord_flip() +
  theme_classic() +
  labs(
    x = "Sub-event type",
    y = "Number of fatalities",
    title = "Top 10 sub-event types by fatalities"
  )

girafe(
  ggobj = bar.china,
  options = list(
    opts_hover(css = "fill:orange;"),
    opts_selection(type = "none")
  )
)
Closure
From the very beggining, I knew I lacked vast information for Hong Kong, but I decided to follow through anyways. This was not about the data but about the testimony of those who spoke out. I collected some of it here, and although I think the the data is real, I know it is not whole.
Missing people, unfair tribunals, shady police forces, controlling government 7; all swept under high technology, countless production and precious economic growth.
People talk a lot about China nowadays, I hope we all become more aware and empathetic towards its people and their struggles, and we never stop recognizing their Government as a dictatorship, no matter how good the tariff deal seems.
Notas
https://en.wikipedia.org/wiki/2014_Hong_Kong_protests↩︎
https://en.wikipedia.org/wiki/2019%E2%80%932020_Hong_Kong_protests↩︎
https://en.wikipedia.org/wiki/1967_Hong_Kong_riots↩︎
Downloaded on December 22nd, 2025↩︎
Ironic name inspired by Ai Wei Wei’s Cockroach documentary, where a police officer, in his testimony, talks about how his coworkers were more aggressive than necessary to ‘neutralize’ a Hong Kongnese rioter and he said: “The hatred is there”.↩︎
This carousel was done taking inspiration from: https://github.com/dimanech/scroll-snap-carousel and some (a lot) of Googling.↩︎
Check out Ai Wei Wei’s S.A.C.R.E.D. Installations and testimony from his imprisonment.↩︎