---
title: "DO PEOPLE EVEN RIOT?"
description: |
An angry look at riots, fatalities & police brutality.
author:
- name: Gabriela Galeano
affiliation: Universitat de València
affiliation-url: https://www.uv.es
date: 01-7-2025 #--
categories: [trabajo BigData, riots, police brutality] #--
favicon: "./imagenes/imagen_01.png"
title-block-banner: true #- {true, false, "red","#AA0000"}
title-block-banner-color: "white" #-"#FFFFFF"
toc-depth: 3
smooth-scroll: true
format:
html:
#backgroundcolor: "#F1F3F4"
#embed-resources: true
math: mathjax
link-external-newwindow: true
#css: assets/my_css_file.css #- CUIDADO!!!!
code-tools: true
code-link: true
include-in-header:
- text: |
<link rel = "shortcut icon" href = "imagenes/uv.jpg" />
---
# Why do this?
I was born and grew up in Venezuela, in Los Teques, a suburb, a barrio; I was a kid and teen who grew up hearing about it: *"Protestas estudiantiles y paro de universidades", "Estudiante de la UCV asesinado por policía en protesta", "Marcha de la Oposición convocada en Caracas", "Encarcelan a protestante"*... It was all around. I grew distant from the topic. After emigrating I decided to look back at it. I was surprised to find the same rage. This website is me looking forward, after I gathered the courage to look back. This web comes from that rage: I am angry, that is my why.
As for Hong Kong, I've been deeply moved by Ai Wei Wei's activism and art. [^1]
[^1]: You can start by watching this documentary 'Cockroach': https://www.aiweiwei.com/cockroach
Lastly, to feed the fire, the current (2025)[^2] global panorama for democracy makes it impossible to look away, with all the propaganda and misleading information running around I wanted to know, first- hand what is happening: Who is dying and how are they getting killed; what are people going against when they fight for their rights *despite, despite, despite.*
[^2]: I write the year in parenthesis for two reasons: (1) Context, (2) Because I hope future people need to know the year as it is no longer like that.
------------------------------------------------------------------------
# Scraping & Tidying Up
We use data from ACLED (Armed Conflict Location & Event Data Project) a global, independent monitor that collects the highest-quality and most widely used near-real-time source on political violence and protest data worldwide.[^3]
[^3]: Find more about ACLED: https://acleddata.com/conflict-data
We work with data-frames regarding number of: Events targeting civilians, political violence events & reported civilian fatalities; in order to explore its aggregated trends, patterns and, hopefully, shine some light on what people are facing when protesting and exercising their rights. Additionally, I'd like to raise awareness about police brutality in the case of authoritative governments (for which we devote two more tabs, focusing on the cases of Venezuela and Hong Kong).[^4]
[^4]: For Venezuela we focus mainly on the prolongued period of riots agaisnt the ilegitimate governor Nicolás Maduro, and for Hong Kong and China on the riots of 1967 and 2019 for human and constitutional rights, respectively.
We start the code, then, by loading the downloaded[^5] data-series to the global:
[^5]: Downloaded on November 30th, 2025
```{r}
#install.packages("readxl")
#install.packages(tidyverse)
#install.packages(gghighlight)
#install.packages(gt)
#install.packages("ggiraph")
#install.packages("gtsummary")


library(ggplot2)
library(ggiraph)
library(gghighlight)
library(tidyverse)
library(gt)
library(readxl)


df_target <-read_excel ("datos/number_of_events_targeting_civilians_by_country-year_as-of-21Nov2025.xlsx")

df_pol <-read_excel("datos/number_of_political_violence_events_by_country-year_as-of-21Nov2025.xlsx")

df_fatalities <- read_excel ("datos/number_of_reported_civilian_fatalities_by_country-year_as-of-21Nov2025.xlsx")

#I rename the EVENTS column in df_target, since it has the same name as an existing one from df_pol:
df_target <- rename(df_target, "events_target"= "EVENTS")
df_pol <- rename(df_pol,"events_pol"= "EVENTS")

#I merge all time series to a same dataframe:

df <- full_join(df_fatalities, df_pol) |>
  full_join(df_target)

# I clean up the global
rm(df_fatalities,df_pol, df_target)

#We create another data-frame with a dummy variable, that we use later on. The dummy is constructed as follows: 1 if the number of fatalities is greater than the mean number of fatalities, and 0 if otherwise.

df_lm <- df |> mutate(countries_dummy=
                      (if_else(
                        FATALITIES > mean(FATALITIES, na.rm= TRUE),
                               "1", "0")))
```
------------------------------------------------------------------------
# Global Overview
## Look around
Here's a table [^6] with all the different parameters for all countries in the data-frame. You can either look for your countries or parameter of interest in the search bars; as well as organize them descending/ ascending to see which country and/ or which year has the highest value for a certain parameter. N/A's are kept because having no information, in this case, means information of another kind *(I'm not being mysterious, I mean that it can point to a lack of transparency or coverage by the media of the issues faced that year in that country).*
[^6]: Table inspired in https://posit.co/blog/new-in-gt-0-9-0-interactive-tables/
Some recommended searches are: Palestine, Syria, Ukraine, Angola, Nigeria and the United States.
::: column-margin
{width="50px" fig-align="left"}
:::
```{r}
gt <- df |>
  dplyr::select(
    COUNTRY, FATALITIES, events_pol, events_target, YEAR,
    Fatalities = FATALITIES,
    Political_Violence = events_pol,
    Targeting_Civilians = events_target)

gt |>
  gt() |>
  opt_interactive(    use_search = TRUE,
    use_filters = TRUE,
    use_resizers = FALSE,
    use_highlight = TRUE,
    use_compact_mode = FALSE,
    use_text_wrapping = FALSE,
    use_page_size_select = TRUE)
```
## Trends
Here we roughly show the trends of each time series to get a grasp of their evolution[^7]. We do this per country, throughout the years. You can hover around to see which trend belongs to which country.
[^7]: Interactive trends inspired in https://r-graph-gallery.com/412-customize-css-in-interactive-ggiraph.html
We can clearly observe a couple countries jumping to higher values these recent years, like Yemen, Syria, Mexico, Palestine and Ukraine. And we can see some who also jumped in previous years, like Nigeria, Angola, Sudan and Eritrea.
Each of these jumps (which are mostly constant across the 3 series) are each defined by a political turmoil period. Whether it is Russia's invasion of Ukraine, Mexico's prostest against violent crime and President Claudia Sheinbaum's government, Syria and Palestine's crises due to Israeli attacks And, looking a bit back, we find that Angola's jump, for insance, was due to its devastating Civil War from 1975 to 2002.
```{r}
p.fatal <- df |>
  ggplot(aes(
    x = YEAR,
    y = FATALITIES,
    group = COUNTRY,
    data_id = COUNTRY
  )) +
  geom_line_interactive(
    colour = "#003B5D",
    linewidth = 0.5,
    hover_nearest = TRUE,
    aes(tooltip = COUNTRY)
  ) +
  theme_classic() +
  labs(
    x = "Years",
    y = "Number of fatalities",
    title = "Fatal Trends",
    subtitle = "per country"
  )

p.fatal <- girafe(ggobj = p.fatal)
p.fatal
p.pol <- df |>
  ggplot( aes(x = YEAR,
           y = events_pol,
           group = COUNTRY)) +
  geom_line(colour = "grey", linewidth = 0.5) +
  theme(legend.position = "none") +
  labs(
    x = "Years",
    y = "Number of Political Violence Events",
    title = "Political Violence Trends",
    subtitle = "per country") +
  geom_line_interactive(
    colour = "#003B5D",
    linewidth = 0.5,
    hover_nearest = TRUE,
    aes(tooltip = COUNTRY)
  ) +
  theme_classic()

p.pol <- girafe(ggobj = p.pol)
p.pol
p.target <- df |>
  ggplot( aes(x = YEAR,
           y = events_target,
           group = COUNTRY)) +
  geom_line(colour = "grey", linewidth = 0.5) +
  theme_bw() +
  theme(legend.position = "none") +
  labs(
    x = "Years",
    y = "Number of Events Targeting Civilians",
    title = "Civilian-targeted Events Trends",
    subtitle = "per country") +
  geom_line_interactive(
    colour = "#003B5D",
    linewidth = 0.5,
    hover_nearest = TRUE,
    aes(tooltip = COUNTRY)
  ) +
  theme_classic()

p.target <- girafe(ggobj = p.target)
p.target
```
------------------------------------------------------------------------
## Are they related?
Something else I was interested in looking at was correlations between these variables, maybe even a simple regression; so, next, we take a look at a correlation matrix and we build a couple linear models with the variables.
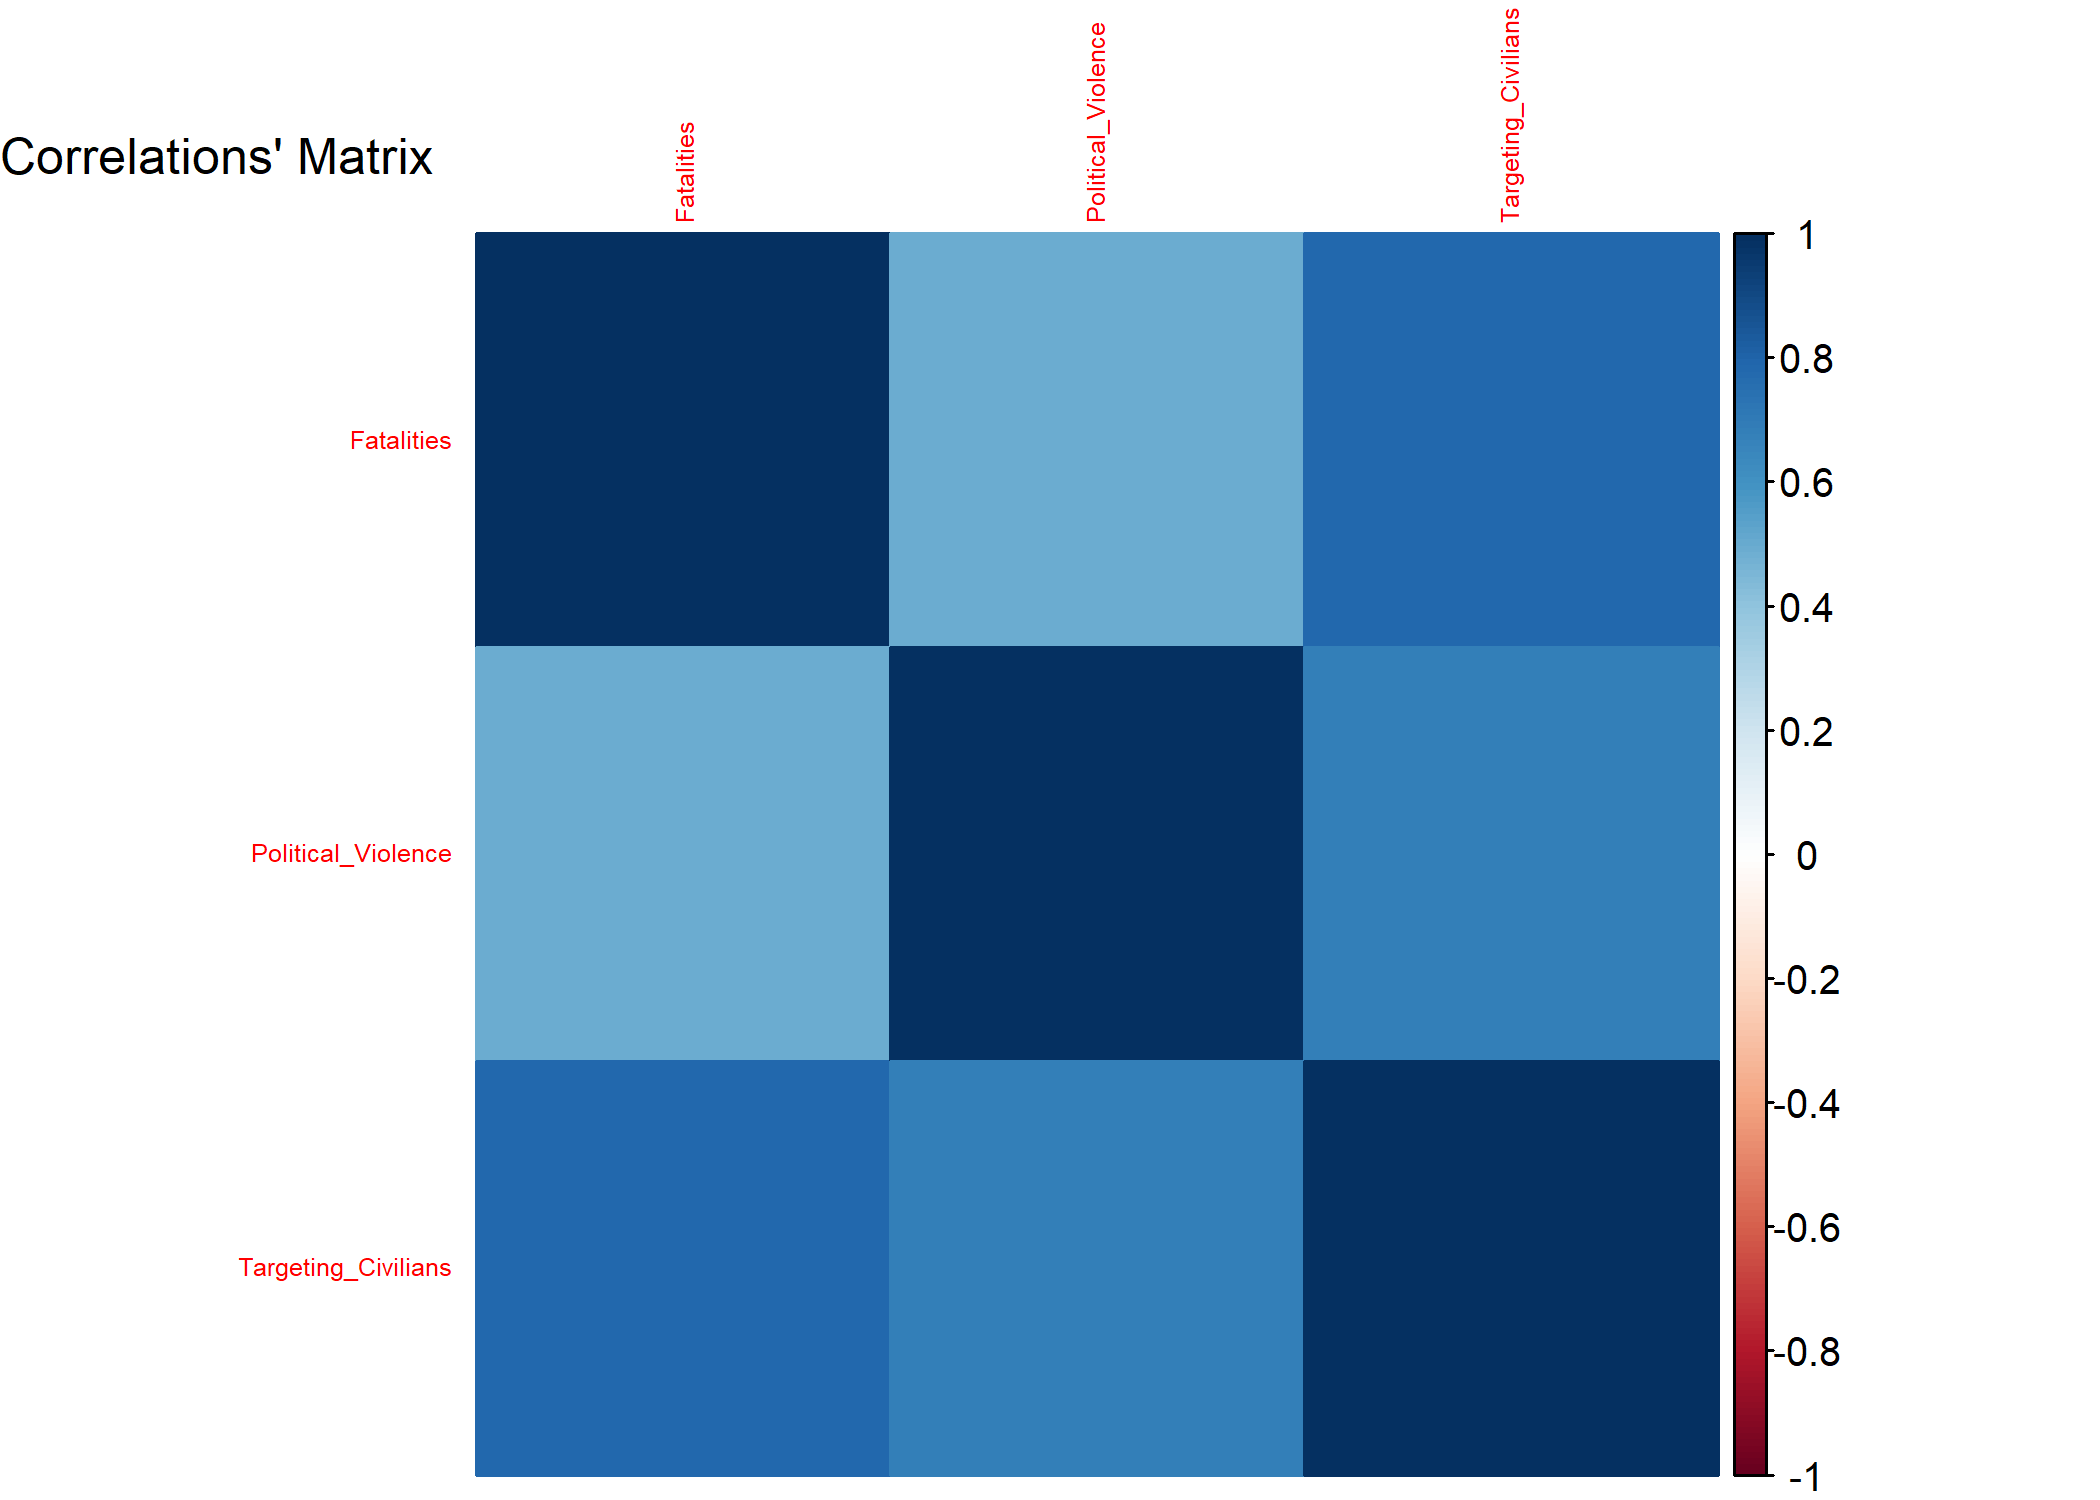
### Correlations
```{r}
# install.packages("corrplot")
library(corrplot)

df_corr <- df |> drop_na() |>
  select(FATALITIES,events_pol, events_target) |>
  rename(Fatalities = FATALITIES,
    Political_Violence = events_pol,
    Targeting_Civilians = events_target) |>
  cor()

corrplot(
  df_corr,
  method = "color",
  order = "alphabet",
  sig.level = 0.01,
  tl.cex = 0.5)

mtext(
  "Correlations' Matrix",
  side = 3,
  line = 1,
  adj = 0)
```
We observe that all correlations are significant at 0.01 p-value and they are positive, as expected. We see that Number of Fatalities and Number of Events Targeting Civilians show the highest correlation with each other.
### Linear Models
Now, onto the simple regressions, which follow the subsequent equations: LM_1 and LM_2 respectively in the code
\begin{equation}
N_{\mathrm{Fatalities}}
=
\alpha
+
\beta\, N_{\mathrm{Events\;Pol}}
+
\gamma\, N_{\mathrm{Events\;Target}}
\end{equation} \begin{equation}
N_{\mathrm{Fatalities}}
=
\alpha
+
\delta\, \mathrm{countries\_dummy}
+
\beta\, N_{\mathrm{Events\;Pol}}
+
\gamma\, N_{\mathrm{Events\;Target}}
+
\varepsilon
\end{equation}
```{r}
lm_1 <- lm(FATALITIES~events_pol + events_target,data= df)
lm_1 <- summary(lm_1)
lm_1
lm_2 <- lm(FATALITIES~ countries_dummy + events_pol + events_target,data= df_lm)
lm_2 <- summary (lm_2)
lm_2
```
Putting into words what we obtained through this simple modelling [^8], we would have that:
[^8]: It is simple as we are not controlling for any variables, and we are not checking for econometric estimation problems ex. Endogeneity (which are likely to be present).
- Both coefficients are significant at the lowest p-value (virtually 0). Political violence has a negative effect, whereas Events targeting civilians have a positive one. The adjusted R-Squared of the model is 61.16%.
- All coefficients are again significant (now including the dummy), the sign of the coefficients stay constant, and the dummy has a positive coefficient; meaning that those countries above the mean have an average of 521 more fatalities than those below. The adjusted R-Squared of the model is 63.23%.
------------------------------------------------------------------------
# What to take with you
There have been multiple extraordinary spikes in the number of fatalities, events targeting civilians and events of political violence; people have to riot more, and they are being faced with more violence. In the decline of democracy, power play between Government and civilians is growing polarized. More and more events are leaving fatalities, one thing is leading to the other when it shouldn't. Even though it is not a 'common' trend [^9], it is concerning enough.
[^9]: "FIRST THEY CAME" By Martin Niemöller
The purpose of this is not to guilt-trip you, but to make you aware, even if it just of the tip of the iceberg. I also hope this serves as inspiration that you can show you care in many levels; and no matter how small (like a programming assignment) it is always worth it.
------------------------------------------------------------------------
# Special thanks
- To my sister, Estefania Galeano, for the quality checks;
- To Ai Wei Wei, and many other artist and activists that inspire me;
- To my professor, Pedro Pérez, who gave me the skill to do this and reminded me that small acts [^10] matter.
[^10]: Like complying with a strike ;)
<br>